An audiogram is a chart that shows your hearing ability and helps identify the degree of hearing loss. It provides two key reference values: frequency (measured in Hertz, Hz) and intensity or volume (measured in decibels, dB). Learning how to read an audiogram allows you to better understand your hearing health and determine whether you may benefit from hearing aids or other support.
How to Read an Audiogram
Frequency (Hz):
The X-axis, Displayed across the bottom of the chart (horizontally), common test frequencies include 125, 250, 500, 1000, 2000, 4000, and 8000 Hz. Smaller numbers represent lower-pitched sound (e.g., a bass drum), while larger numbers represent higher-pitched sound (e.g., a whistle).
Volume / Intensity (dB):
The Y-axis, Displayed along the left side of the chart (vertically), ranging from 0 to over 110 dB. Smaller numbers indicate softer sound. If you can hear very soft sounds clearly, your hearing is considered normal. If not, this may indicate some degree of hearing loss.
Symbols:
“O” = Right ear hearing thresholds
“X” = Left ear hearing thresholds
For example, the audiogram shown below illustrates a case where hearing loss occurs from low to high frequencies, ranging from mild to moderately severe hearing loss.
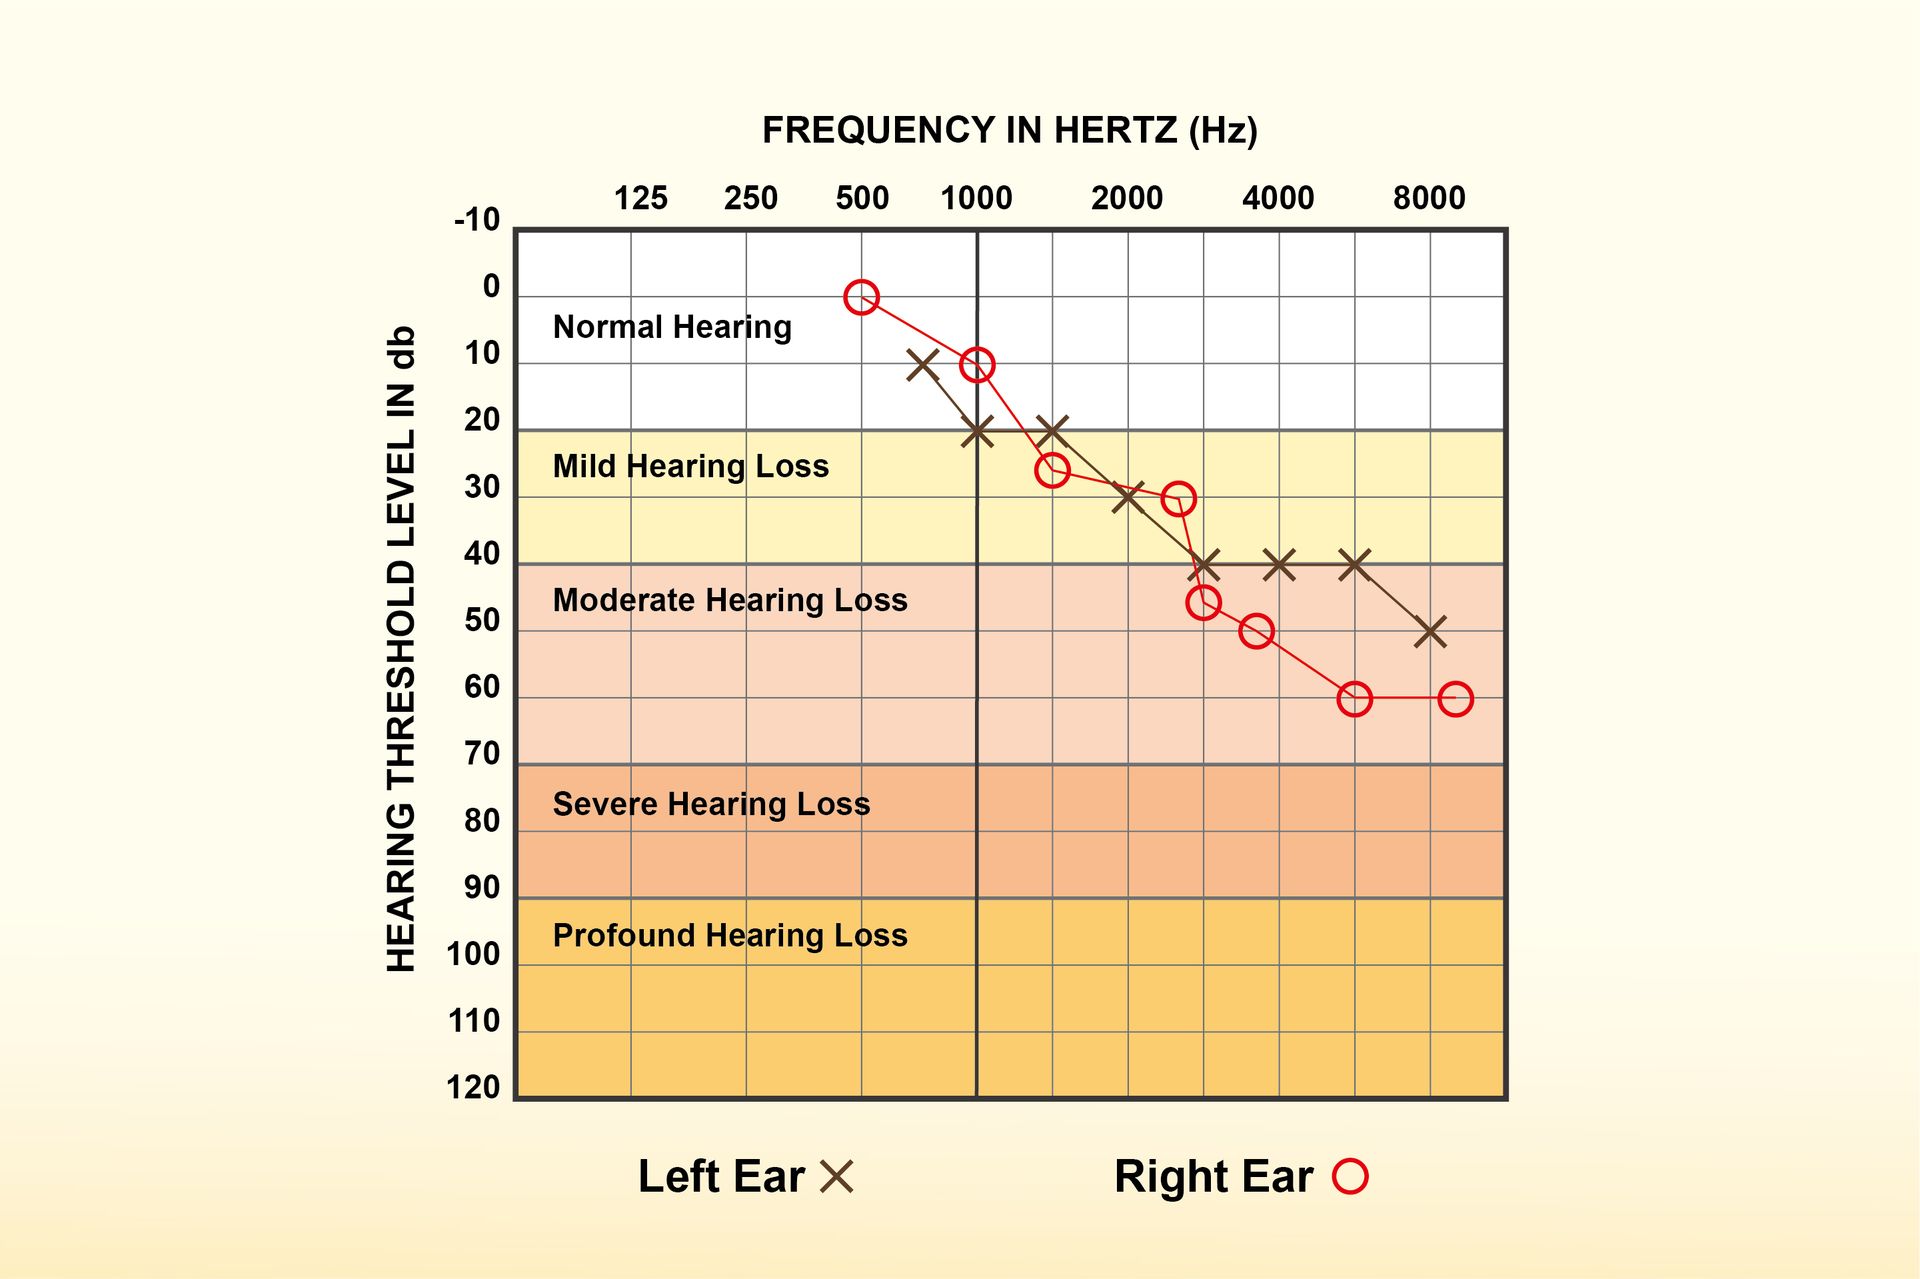
Classification of Hearing Loss
The hearing test measures the softest sounds you can detect; the higher the number, the greater the hearing loss. Based on international standards, hearing loss is also commonly divided into six levels of severity:
Normal hearing: 25 dB or better
Mild hearing loss: 26–40 dB
Moderate hearing loss: 41–55 dB
Moderately severe hearing loss: 56–70 dB
Severe hearing loss: 71–90 dB
Profound hearing loss: Greater than 91 dB
In general, anyone with measurable hearing loss is encouraged to use hearing aids to improve communication and overall quality of life.
Hearing loss is also commonly divided into six levels of severity:
Normal hearing: 25 dB or better
Mild hearing loss: 26–40 dB
Moderate hearing loss: 41–55 dB
Moderately severe hearing loss: 56–70 dB
Severe hearing loss: 71–90 dB
Profound hearing loss: Greater than 91 dB
In general, anyone with measurable hearing loss is encouraged to use hearing aids to improve communication and overall quality of life.
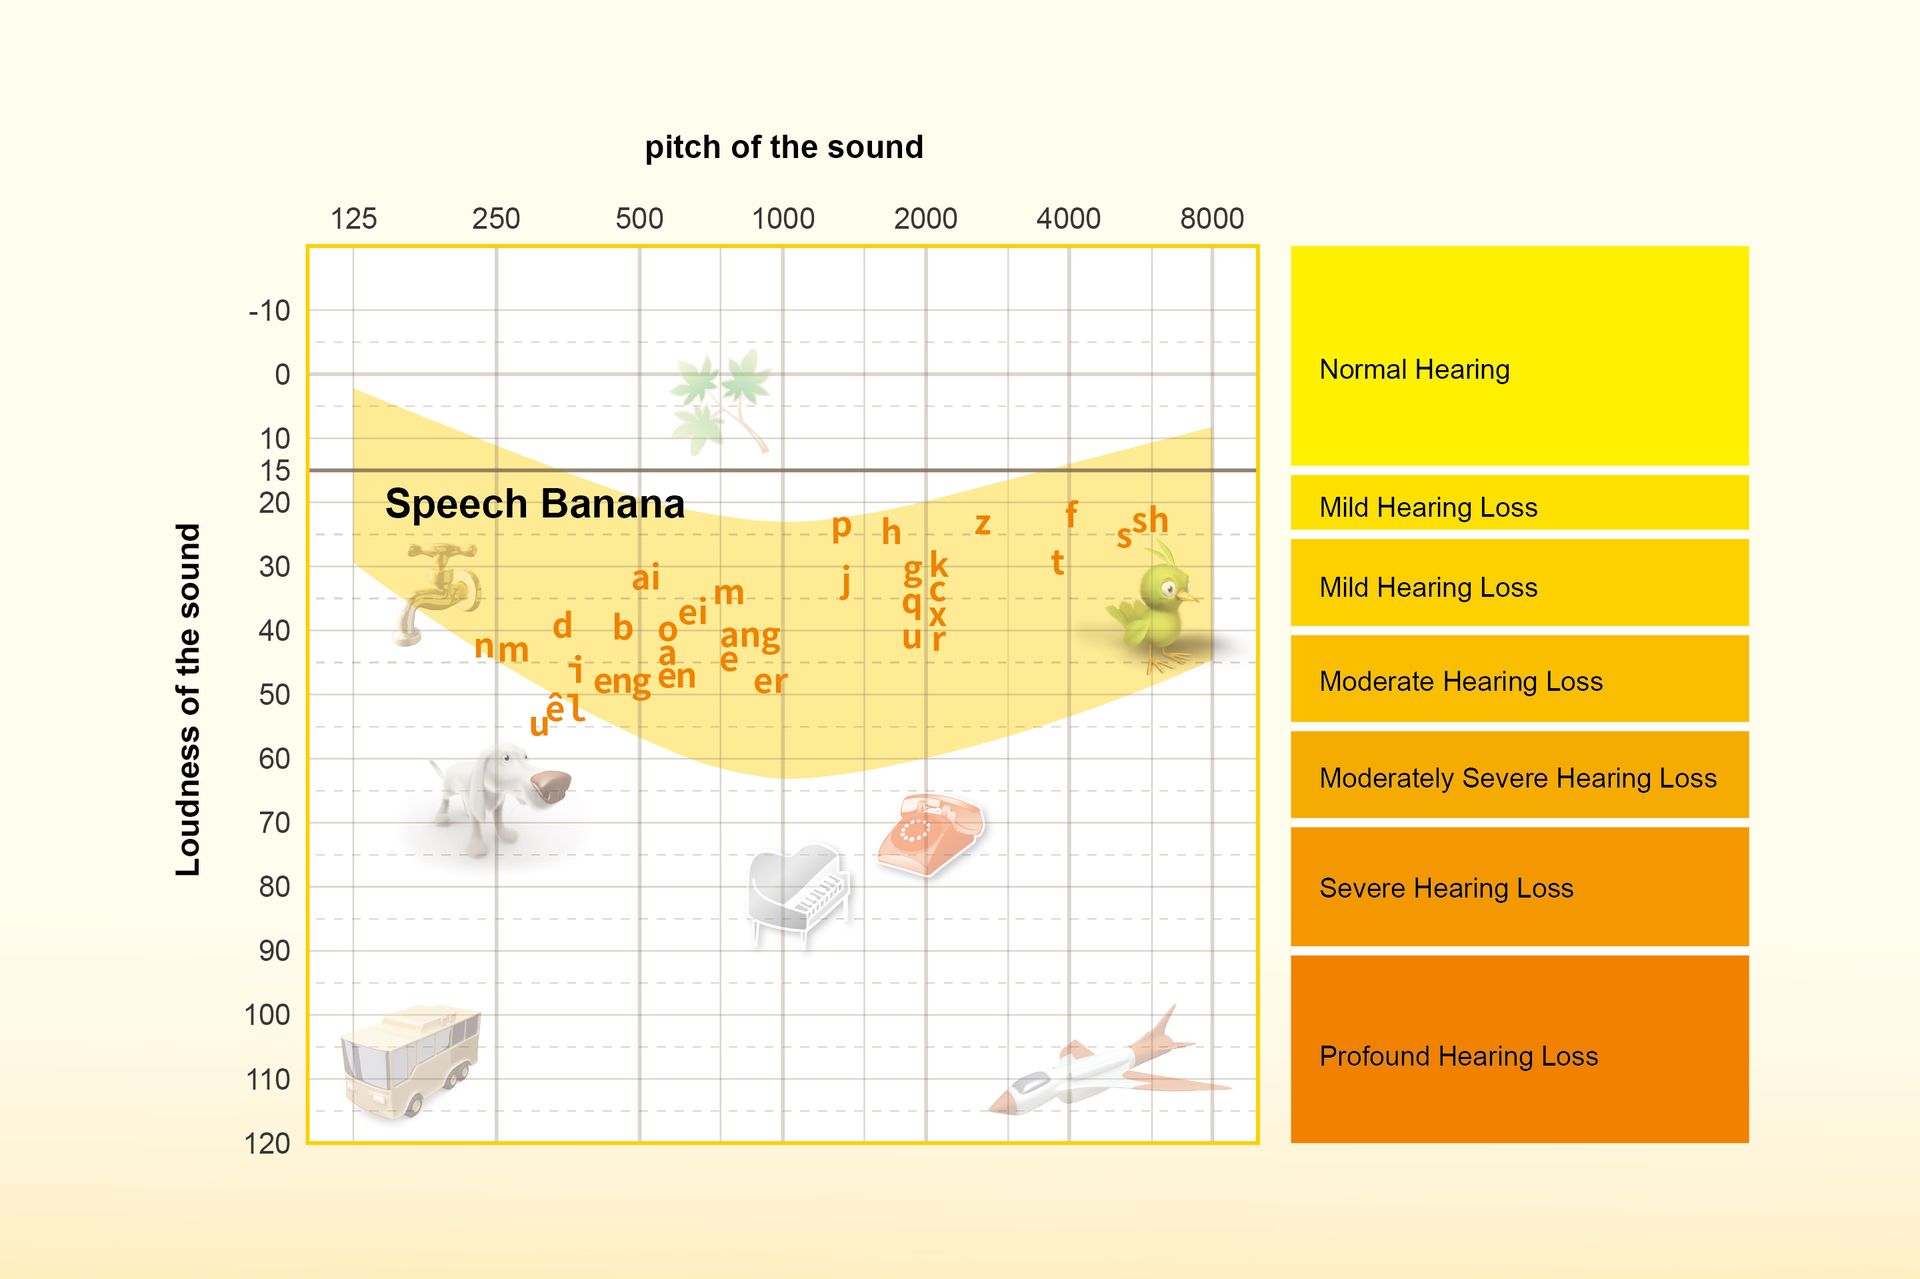
What Sound Can You Hear?
By comparing your audiogram with the “speech banana” or sound distribution chart, you can identify what sounds you may or may not be able to hear without hearing aids.
The yellow“banana-shaped” area represents the range of human speech sounds. To understand everyday conversation, you must be able to hear sounds within this area.
Mild hearing loss (26–40 dB): Even in quiet environments without background noise, some parts of speech may be missed.
Moderate to severe hearing loss (41–90 dB): Conversations require the speaker to raise their voice significantly in order for you to hear and understand.
Profound hearing loss (>91 dB): Even with hearing aids, communication can remain very challenging. Additional communication strategies (such as lip-reading or captioning) are often needed.